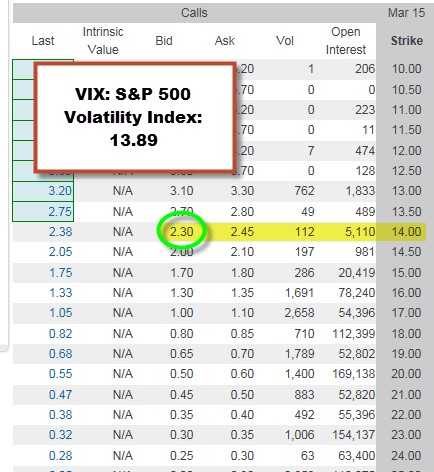
Option returns play a major role in our covered call writing and put-selling strategies. Mega-returns can be quite enticing but also very dangerous. Recently, with market volatility rising exponentially in response to global-economic concerns, a few of our members have inquired about using volatility options (CBOE Volatility Index) based on the S&P 500 volatility as a means of enhancing portfolio returns. The reason these securities caught the eye of our members is the generous potential returns as shown in the screenshot below (before the current spike in volatility) which represents a 16-trading day return:

VIX options chain: 2-26-15
The VIX or CBOE Volatility Index, also known as the investor fear gauge, measures the market’s expectation of 30-day volatility based on option pricing. It is a measure of market risk.
The 3-week return appears to be $230.00/1389.00 = 16.6%. In addition to this incredible opportunity (maybe not), the VIX was quite low in February, 2015 and reasonable expectations of a spike up soon was on the table. So goes the attraction and the thinking. Like most incredible opportunities, if it seems too good to be true, it usually is.
VIX options are a completely different type of security from the typical equity options we trade. The recent volatility related to issues in Greece, Russia, Japan and China is a red flag as to the risk we are taking when predicting market assessment of future volatility. That doesn’t even factor in the Fed watch for a future rate hike in short-term interest rates. We would have to master a whole new set of parameters before it would make sense to consider using VIX options although I do see a potential use for them by retail investors which I will discuss later in this article. First, let’s explore the unique qualities of VIX options compared to standard equity options:
Comparison of VIX options to standard equity options
- There is no underlying security to buy because it is based on futures contracts for an index. Therefore, covered call writing is eliminated
- Since the options are based on VIX futures contracts, it may not track the actual VIX accurately. A large spike or drop in the VIX will not be adequately represented by these options
- You must trade VIX options in a margin account and therefore cannot be used in a self-directed IRA account
- These are European style options compared to the American style options we are used to. This means that they cannot be exercised until expiration Friday
- A higher level of trading approval is required than for covered call writing
- Obtaining information on the Greeks is difficult because these options are based on futures and not the actual index. Many brokerages have inaccurate Greek stats on these securities
- These options expire on a Wednesday, not a Friday as we are used to
- Huge returns always mean huge risk. There are no free lunches out there
Discussion
Since we cannot use these options for covered call writing and the parameters are so different than equity options, the use of this strategy in our options portfolio should be reserved for more sophisticated investors who have studied and practiced the nuances and differences of VIX options compared to equity options. Also, one’s personal risk tolerance should align with the high-return/high-risk profile of VIX options.
Possible use of VIX options by retail investors
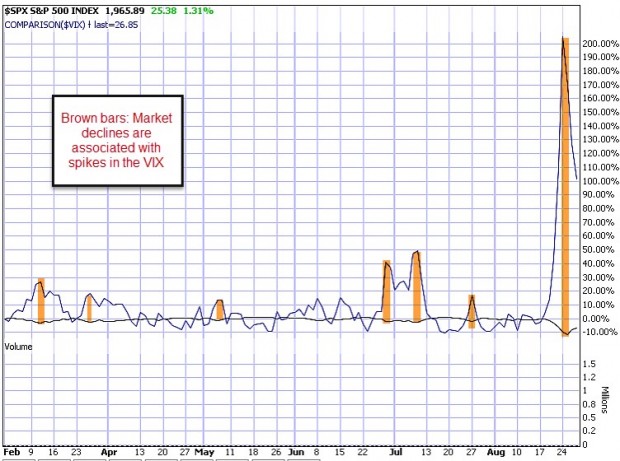
This is just a thought, not necessarily a recommendation: Since the VIX historically is inversely related to the S&P 500 (market goes up, VIX goes down and vice versa), buying deep out-of-the-money VIX call options can serve as a hedge for a portfolio in much the same way buying puts can protect a downturn in our portfolios. The chart below shows the inverse relationship between the VIX and the S&P 500 as of 8/27/2015:

Inverse relationship between the VIX and the S&P 500
Market tone
Market volatility elevated dramatically early this week as fears about China’s economic downturn intensified. Asian markets were hit the hardest. The VIX (CBOE Volatility Index), which measures US stock market volatility, hit 53 on Monday, then dropped back below 27 on Friday. This week’s reports:
- Second-quarter GDP was revised up to 3.7% from an initial estimate of 2.3%, mainly due to increased consumer spending, business investment and exports
- Bolstering of labor and housing markets and inexpensive gasoline boosted consumer spending
- Non-defense capital goods orders excluding aircraft rose 2.2% in July. This was the largest monthly increase in more than a year and a key gauge of US business investment plans
- Total durable goods orders rose 2.0% in July
- US new home sales rose 5.4% in July to a seasonally adjusted annual rate of 507,000 units. Sales were 25.8% above last July
- The S&P/Case Shiller composite index of 20 metropolitan areas increased 5.0% in June from a year earlier
- The Pending Home Sales Index increased 0.5% to 110.9, suggesting further housing market expansion
- US consumer spending rose 0.3% in July. Spending on durable goods rose 1.1%, with automobile purchases driving half of the increase
- The personal consumption expenditures (PCE) measure of inflation rose 0.1% for the month, 0.3% for the year
- The Conference Board’s gauge of consumer confidence rose from 91.0 in July to 101.5 in August, the highest reading since January
- However, the University of Michigan’s consumer sentiment reading fell from 93.1 in July to 91.9 in August, reflecting the impact of increased financial volatility
- Initial jobless claims rose 6,000 to 271,000 for the week ending August 22nd
- Continuing claims climbed 13,000 to 2.27 million for the week ending August 15th
For the week, the S&P 500 rose 0.91% for a year to date return of (-) 3.40%.
Summary
IBD: Market in correction
(SIX:GMI): 0/6- Sell signal since market close of August 20, 2015
(TO:BCI): This site remains bullish on the US economy but concerned about market over-reaction (my opinion) t0 global-economic events and the enhanced market v0latility. At this time, I am retaining all shares currently in my portfolios but not purchasing new ones or writing calls until the late week rebound appears sustainable.
