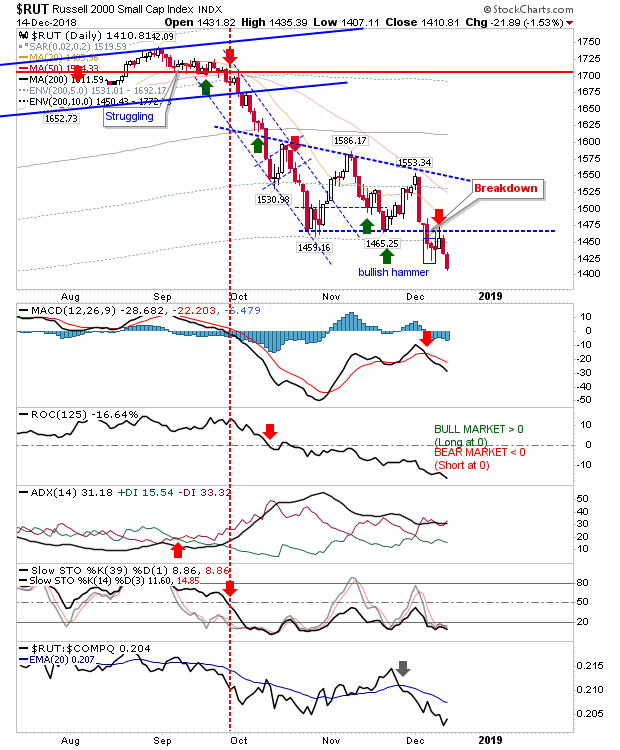
While it wasn't the biggest loser on the day Friday, the Russell 2000 did manage to undercut the bullish hammer—ending any chance for a Santa rally of note. Look for this weakness to repeat for the S&P and NASDAQ.
The Russell 2000 is still in the accumulate zone for investors and Friday was another chance to add to positions. Again, this may be only the start of the decline but without knowing what may be coming one needs to take chances as they appear.
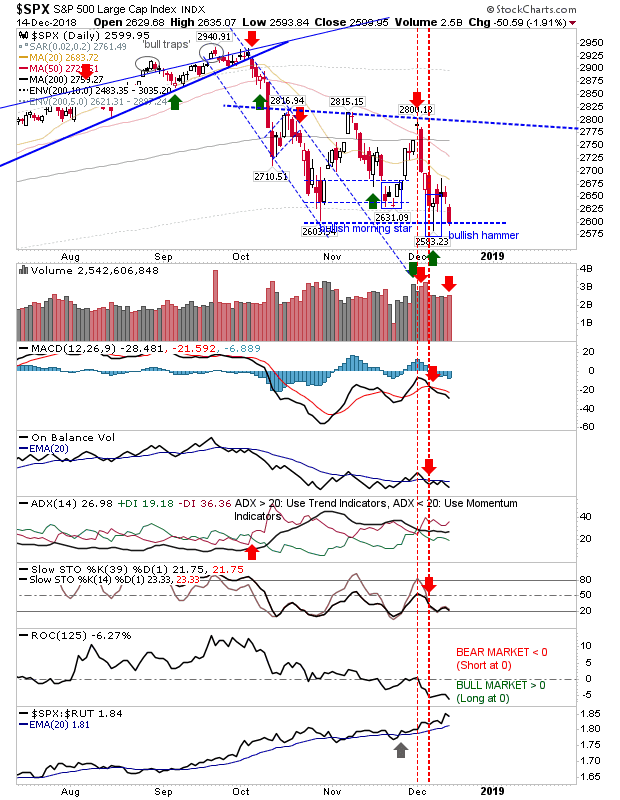
The S&P is back to minor support from the October swing low but it hasn't broken the bullish hammer low from December, although given what's happened in the Russell 2000 this is now looking more likely. There isn't much for near-term buyers to lean on but another spike low is perhaps the preferred option.
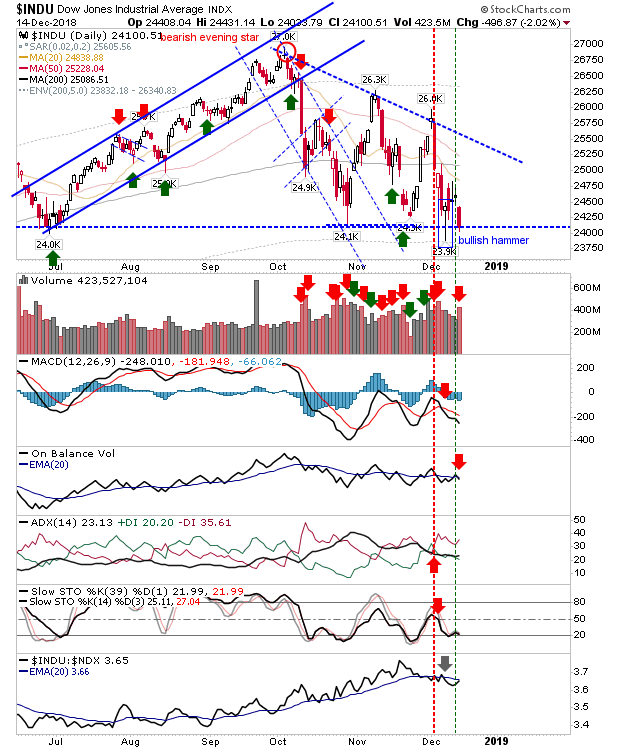
The Dow Jones Industrial Average is sitting right on the July swing low which makes it a relatively low risk buy with a stop on a loss of 23,900; it's perhaps the best chance for bulls to try and get a quick trade off.
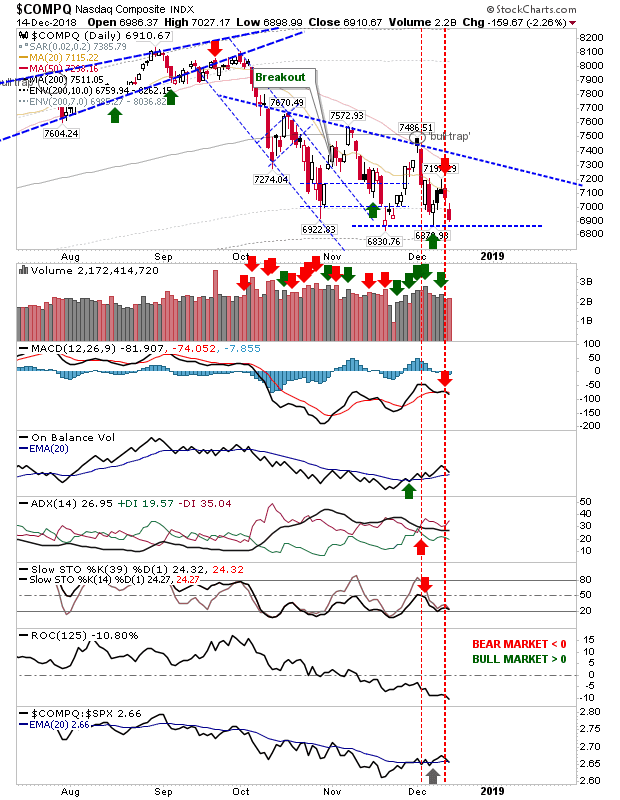
The NASDAQ is in the same position as the S&P; sitting just above the December swing low. Of technicals, only On-Balance-Volume is positive but whether bulls can make another stand remains to be seen. As with the S&P, a fresh spike low might be the best chance for bulls to put in a bottom.
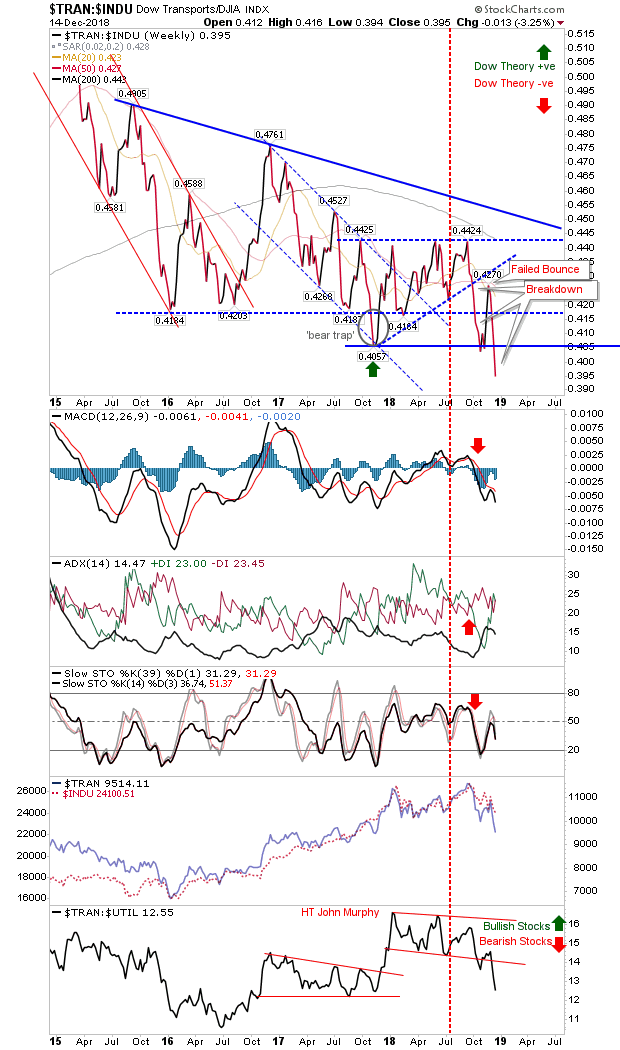
The relationship between the Dow Jones Industrial Average and Transports, and Transports and Utilities continues to favor bears.
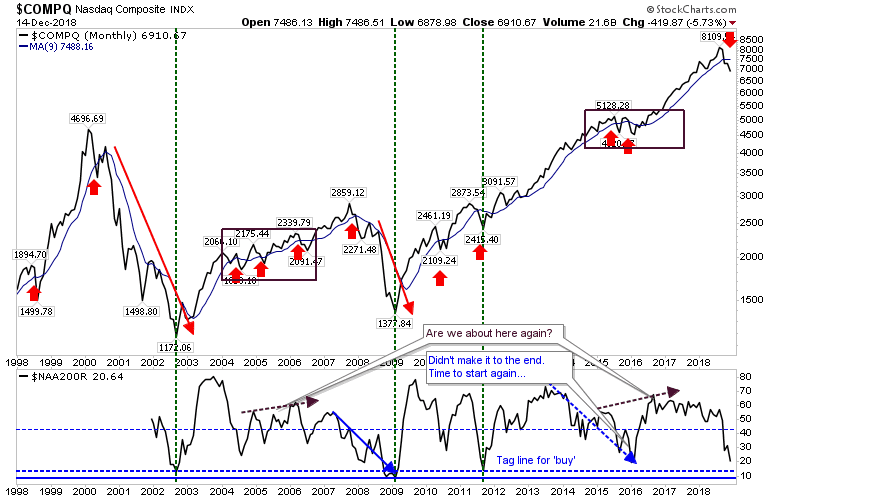
The monthly NASDAQ is on a confirmed 'sell' but it hasn't tagged the 'buy' line which would give some indication that a trade-worthy swing low would be in play—one that could last months, if not years—although some 2000-02 or 2007-09 style sell-off is due soon.
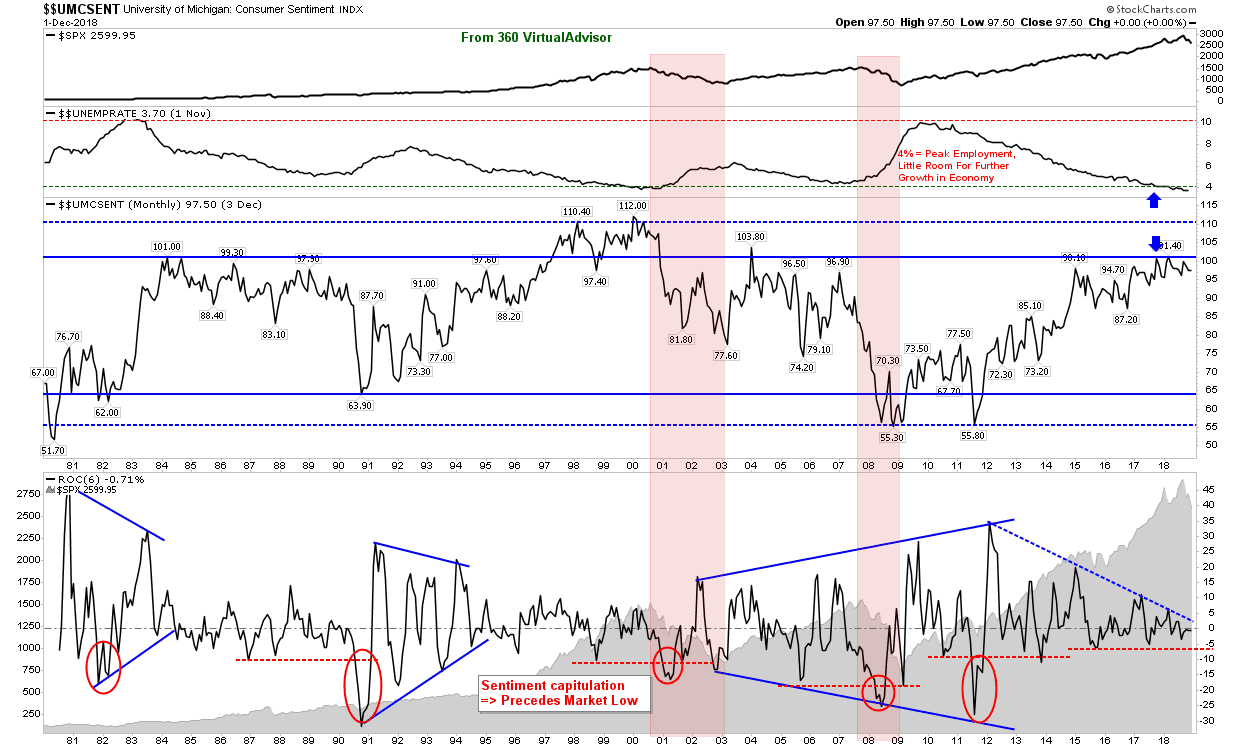
The main economic chart I'm watching is the level of Consumer Sentiment / Unemployment. Unemployment has fallen well below levels typically associated with an economic peak, suggesting a recession is just around the corner. While consumers are slowly losing their optimism (descending triangle in the chart), another reason to suggest things are going to get tougher before they get better.
For today, keep to the Russell 2000. If bulls are to get any kind of rally over the holiday period this has to dig in either today or Tuesdayat the latest. There is very little else out there to suggest things are going to turn around for bulls anytime soon.
However, this is prime investor-buying territory; buy-and-holders should keep on dabbling as we enter the third month for this opportunity. The last time investor-buyers have seen this level of opportunity was February 2016. Again, this is not a trade signal, but an invest signal.
