Fabless semiconductor company Himax Technologies (NASDAQ:HIMX) stock has been struggling to regain its pre-COVID February highs underperforming the benchmark S&P 500 index. The semiconductor sector performance has been split this year with graphic processor chip companies leading the way.
Himax is a fabless chipmaker specializing in display and interface drivers that can benefit from demand growth in wearables, monitors and tablets to growing adoption of augmented and virtual reality (AR/VR) and Internet of Things (IoT). The rollout of 5G wireless is expected to enhance the AR/VR and IoT segment which could be a tailwind for long-term holders. Investors seeking a long-term cheap semiconductor stock to benefit from 5G tailwinds can monitor opportunistic pullback levels on Himax shares.
Q3 FY 2020 Earnings Release
On Aug. 6, 2020, Himax released its fiscal third-quarter 2020 results for the quarter ending June 2020. The Company reported an earnings-per-share (EPS) profit of $0.01 excluding non-recurring items matching consensus analyst estimates for a profit of $0.01. Revenues grew 10.5% year-over-year (YoY) to $187 million matching analyst estimates. The Company raised Q3 2020 EPS guidance to $0.03 to $0.04 range from $0.00 estimates.
Q3 2020 Conference Call Takeaways
Himax President and CEO, Jordan Wu, and CFO Eric Li provided insights into the Q2 results. Large panel integrated circuits (ICs) composed 31% of total revenues. Small and medium-sized display drivers sales grew to $98.8 million up 20.9% YoY driven by tablet and smartphone sales offset by automotive display sales.
Tablet sales surged due to stay and work-at-home mandates bolstering TDDI products for tablets which accounted for 52.8% of total sales and expected to remain robust through the rest of 2020. This is expected to rebound with restart initiatives as commuters get back on the roads.
Worldwide smartphone market demand is expected to decline more than (-10%) for 2020. Driver IC revenues for automotive displays were down (-15.2%) sequentially form the slowdown in consumer demand during isolation mandates.
While COVID-19 pandemic is still creating uncertainty, the demand picture has improved since the first-half of 2020. The foundry shortage is still creating supply chain disruptions, but the Company has pivoted to non-driver technologies including 3D sensing for smartphones and smart door locks and ultralow power smart image sensing for notebooks, televisions, doorbells and air conditioners,” as per CEO Wu.
IP Portfolio
Himax has a rich intellectual property (IP) patent portfolio composed of over 2,900 patents with over 500 pending patents. The Company is often a top-five player is various segments (IE: display drivers, tablets, autos) within integrated circuit (IC) markets but lack the follow through to score homeruns.
The fabless structure intended to drive down costs and bolster margins falls victim to supply chain disruptions and lacks the agility that fab semiconductor companies possess.
Upside Q3 2020 Guidance
On Oct. 6, 2020, Himax issued upside Q3 2020 guidance for the quarter ending Sept. 2020. The Company sees adjust EPS of $0.07 versus $0.04 consensus analyst estimates on revenues of $239.9 million beating analyst estimates for $226.10 million.
Revenues for Q3 rose 46.1% YoY to $239.9 million versus $226.1 million consensus estimates. Gross margins rose to 22.3% exceeding previous guidance of 21%. The Company raised the bar ahead of its official Q3 2020 earnings release scheduled for pre-market Nov. 13, 2020. CEO Jordan Wu stated:
“We are seeing continued strong business momentum across all our major business sectors.”

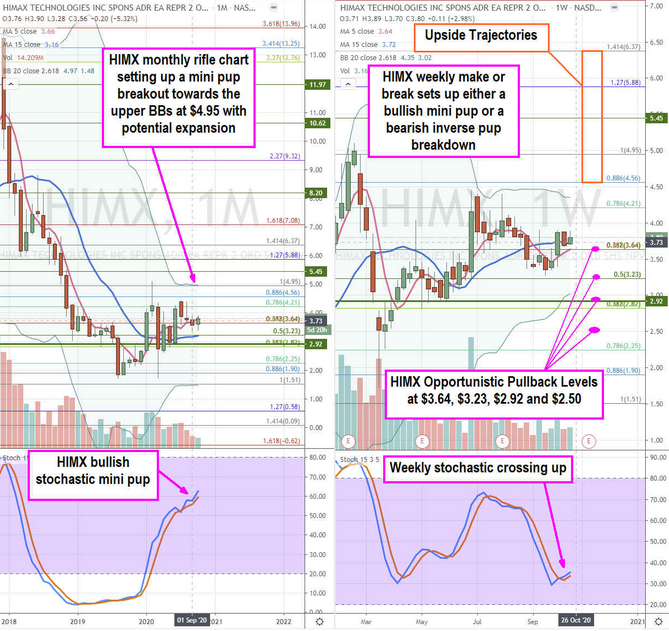
HIMX Opportunistic Pullback Levels
Using the rifle charts on the monthly and weekly time frames provides a broader view of the landscape for HIMX stock. The monthly rifle chart has a stairstep bullish stochastic mini pup trying to form a breakout with the rising 5-period moving average (MA) at $3.66 trying to breakout to the monthly upper BBs at the $4.95 Fibonacci (fib) level.
This weekly stochastic triggered a market structure low (MSL) buy trigger above the $2.93. However, the weekly rifle chart is in a make or break situation which could result in an inverse pup breakdown if the stochastic crosses down or a mini pup if the weekly 5-period MA crosses up through the 15-period MA. The low band weekly stochastic can present opportunistic pullback levels at the $3.64 fib, $3.23 fib, $2.92 weekly MSL/fib and the $2.50 sticky 2.50s zone.
The upside trajectories sit above the weekly and monthly upper Bollinger Bands (BBs) from $4.56 fib to the $6.37 fib. HIMX set the bar high ahead of its Nov. 14, 2020, earnings release which will focus on forwarding guidance since the earnings beat is expected with the raised guidance. Upside trajectories can be driven by multiple expansion heading into earnings.
