
Denbury Resources Inc. (NYSE:DNR) recently reported earnings of 13 cents per share (excluding one-time items) in second-quarter 2019, beating the Zacks Consensus Estimate of 9 cents. The reported earnings were flat year over year.
Total revenues were $343 million, down from $387 million in the year-ago quarter. However, the top line beat the Zacks Consensus Estimate of $332 million.
The better-than-expected results were supported by higher commodity price realizations and cost efficiency. However, the positives were partially offset by lower production volumes.
Denbury Resources Inc. Price, Consensus and EPS Surprise
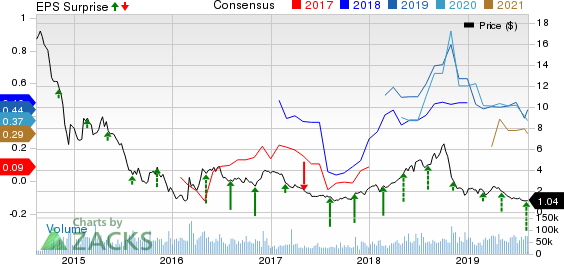
Denbury Resources Inc. price-consensus-eps-surprise-chart | Denbury Resources Inc. Quote
Operational Performance:
Production Declines
During the quarter, production averaged 59,719 barrels of oil equivalent per day (Boe/d) compared with 61,994 Boe/d in the prior-year period.
Oil production averaged 58,034 barrels per day (BPD), down from the year-ago level of 60,109 BPD. Natural gas daily production averaged 10,111 thousand cubic feet (Mcf/d), lower than the year-ago period’s 11,314 Mcf/d.
The company’s production from tertiary operations averaged 38,423 Boe/d, up from 38,079 Boe/d in the year-ago quarter.
Notably, it achieved a 50% year-over-year increase in production from Bell Creek to 5,951 Boe/d in the reported quarter.
Price Realization Up
Oil price realization (including the impact of hedges) averaged $61.92 per barrel in the quarter, increasing from the year-ago level of $58.23. Gas prices declined to $2.01 per Mcf from $2.21 in the year-ago quarter. On an oil-equivalent basis, overall price realization was $60.52 per barrel, higher than the year-earlier level of $56.86.
Cost & Expenses
During the quarter, the company incurred lease operating expenses of $117.9 million, lower than the year-ago period’s $120.4 million. Costs related to transportation and marketing rose to $11.2 million from the year-ago level of $10.1 million. CO2 discovery and operating expenses also increased to $581 thousand from $500 thousand in second-quarter 2018.
Capital Expenditure
Oil and natural gas capital investments were approximately $56 million compared with $72.3 million in the year-ago quarter. Total capital spending (excluding capitalized interest and acquisitions) was $76.9 million, lower than $81.6 million in second-quarter 2018.
Financials
Cash flow from operations was $148.6 million, down from $154 million in the year-ago quarter.
As of Jun 30, 2019, cash balance was around $0.3 million and total debt was $2,480.9 million, with a debt-to-capitalization ratio of 66.1%.
Guidance
Denbury expects to generate free cash flow in the range of $120-$150 million in 2019, assuming oil price to be $55 per barrel. The company tightened its 2019 production guidance from 56,000-60,000 Boe/d to 57,000-59,500 Boe/d, improving the midpoint from 58,000 Boe/d to 58,250 Boe/d, even after the divestment of the Citronella field on Jul 1. Capital expenditure view is reiterated in the range of $240-$260 million, indicating 20-25% decline from the 2018 capital spending level.
Zacks Rank and Stocks to Consider
Currently, Denbury has a Zacks Rank #3 (Hold). Some better-ranked stocks in the energy sector are given below:
Transportadora de Gas del Sur S.A. (NYSE:TGS) is a midstream energy firm. In the trailing four quarters, the company delivered average positive earnings surprise of 114%. It has a Zacks Rank #1 (Strong Buy). You can see the complete list of today’s Zacks #1 Rank stocks here.
World Fuel Services Corporation (NYSE:INT) is an oil and gas refining and marketing company. The company beat estimates in the trailing four quarters, delivering average positive surprise of almost 16.4%. The company has a Zacks Rank #2 (Buy).
Dril-Quip, Inc. (NYSE:DRQ) is a provider of oilfield services for upstream energy companies. In the trailing four quarters, the company delivered average positive earnings surprise of almost 49%. It has a Zacks Rank #2.
More Stock News: This Is Bigger than the iPhone!
It could become the mother of all technological revolutions. Apple (NASDAQ:AAPL) sold a mere 1 billion iPhones in 10 years but a new breakthrough is expected to generate more than 27 billion devices in just 3 years, creating a $1.7 trillion market.
Zacks has just released a Special Report that spotlights this fast-emerging phenomenon and 6 tickers for taking advantage of it. If you don't buy now, you may kick yourself in 2020.
Click here for the 6 trades >>
Dril-Quip, Inc. (DRQ): Free Stock Analysis Report
World Fuel Services Corporation (INT): Free Stock Analysis Report
Transportadora De Gas Sa Ord B (TGS): Free Stock Analysis Report
Denbury Resources Inc. (DNR): Free Stock Analysis Report
Original post
Zacks Investment Research