Technical Analysis #C-COTTON : 2019-02-26
Market participants hope that China will increase US cotton imports along with soybeans
Market participants hope that China will increase US cotton imports along with soybeans. Will Cotton prices rise?
US Secretary of Agriculture Sonny Perdue said that China agreed to buy an additional 10 million tons of US soybeans. The deal was discussed during the meeting of US President Donald Trump and Chinese Vice Premier Liu He. In the framework of trade negotiations, Donald Trump is also going to meet with Chinese President Xi Jinping. Meanwhile, it is known that China has agreed to purchase US agricultural products worth $30 billion. In the 2018/19 agricultural season, China reduced the purchase of cotton in the United States by 28 thousand bales. According to the USDA (US Department of Agriculture), the total volume of cotton exports from the United States has amounted to 977 thousand bales since the beginning of the season. Some investors were disappointed that it was less than the psychological level of 1 million bales. However, the USDA also noted a slight reduction in US cotton crops in the current season to 14.3 million acres, as well as its reserves by nearly 1% to 127.9 thousand bales (480 pounds).
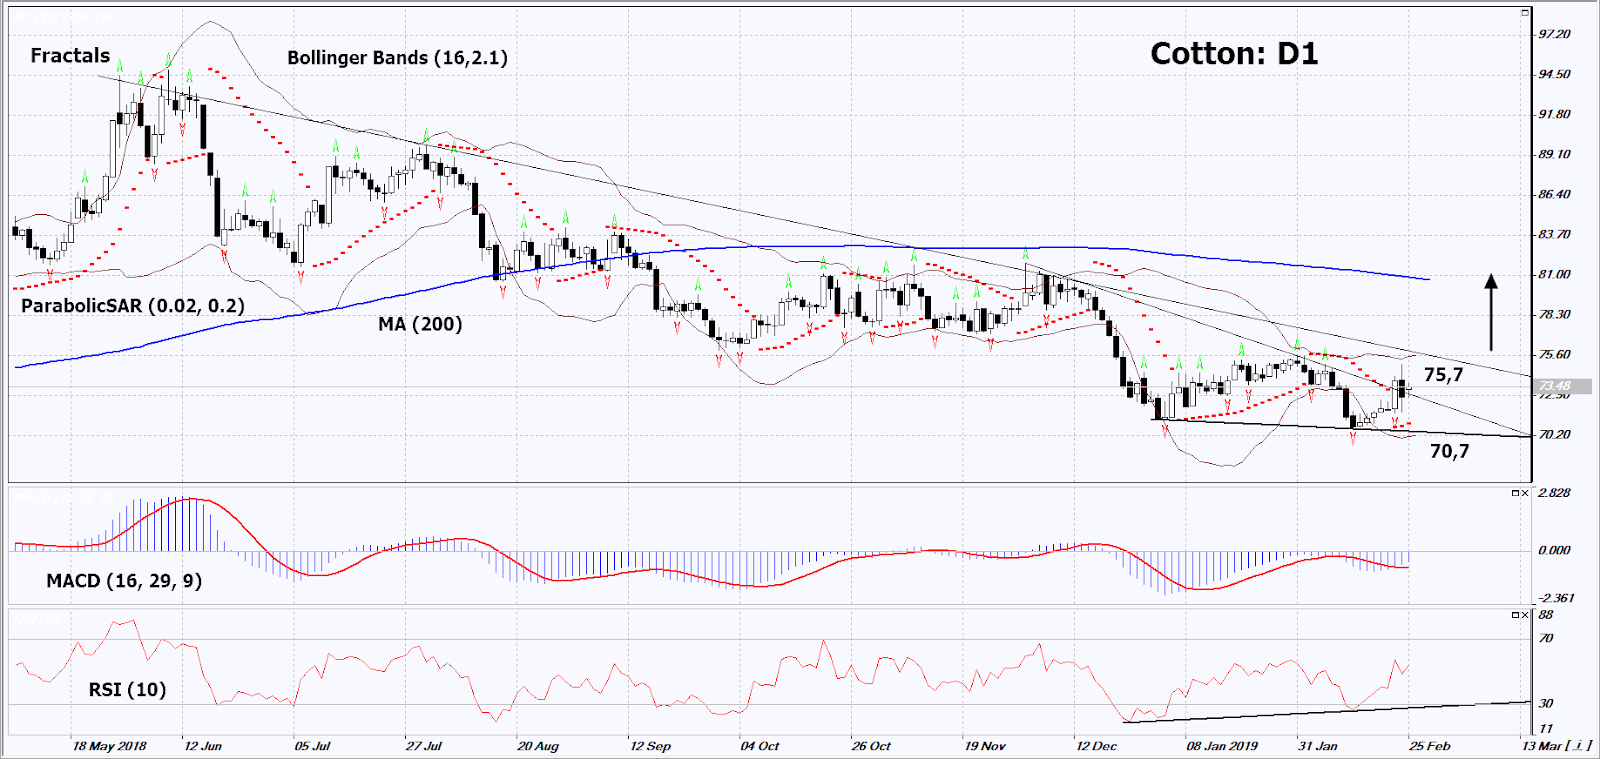
On the daily timeframe, Cotton: D1 has exited the triangle and turned upward. Before opening a buy position, it should overcome the resistance line of the downtrend. A number of technical analysis indicators formed buy signals. The further price growth is possible in case of increase in global demand.
-
The Parabolic Indicator gives a bullish signal.
-
The Bollinger® bands have widened, which indicates high volatility. Both Bollinger bands are titled upward.
-
The RSI indicator is above 50. It has formed a positive divergence.
-
The MACD indicator gives a bullish signal.
The bullish momentum may develop in case Cotton exceeds the upper Bollinger band, its two last fractal highs and the resistance line of the downtrend at 75.7. This level may serve as an entry point. The initial stop loss may be placed below the two last fractal lows, the Parabolic signal, the low since November 2017 and the lower Bollinger band at 70.7. After opening the pending order, we shall move the stop to the next fractal low following the Bollinger and Parabolic signals. Thus, we are changing the potential profit/loss to the breakeven point. More risk-averse traders may switch to the 4-hour chart after the trade and place there a stop loss moving it in the direction of the trade. If the price meets the stop level (70.7) without reaching the order (75.7), we recommend to close the position: the market sustains internal changes that were not taken into account.
Summary of technical analysis
|
Position |
Buy |
|
Buy stop |
Above 75.7 |
|
Stop loss |
Below 70.7 |
Market Overview
The US and China leaders meeting is being planned
US stock indexes gained after US President Donald Trump's announcement that he would postpone the increase in import duties on Chinese goods
Previously, it was supposed to introduce duties of 25% for Chinese goods supplied to the US amounted 200 billion $ a year from March 1, 2019. A meeting between Donald Trump and Chinese President Xi Jinping in Florida is currently being prepared. It may take place within a few weeks. An additional positive for the US stock market was an increase in General Electric (NYSE:GE) shares by 10.8% after it announced the sale of its biotechnology division, Danaher Corporation (NYSE:DHR), for $ 21.4 billion. Danaher’s quotes rose by 8.2%. The S&P500 left less than 5% to its historical maximum. Meanwhile, market participants expect the S&P500 companies to reduce their total profits by 0.9% in the first quarter of 2019. The ICE (NYSE:ICE) US Dollar Index continued falling in anticipation of an important event - Fed Chairman Jerome Powell's speech on the Senate Banking Committee at 16:00 CET. At the same time consumer confidence index for February will be published.
EUR/USD showed a slight increase and again entrenched above the psychological level of 1.13
There wаs no significant news for euro yesterday, whereas the British pound gained 4-week high due to a report on the possible cancellation of Brexit. The exit of Great Britain from the European Union is to be held on March 29, 2019. Prime Minister Theresa May may propose to ban Brexit altogether without an agreement with the European Union. In this case, the entire exit procedure will be postponed for several months. In the meantime, the next vote on Brexit is scheduled for March 12 in the British Parliament. European stock indices fell against the background of negative corporate indicators of the Danish Jyske Bank and the French automaker PSA, which owns the Peugeot brand. Today meaningful macroeconomic statistics is not expected in the Eurozone.
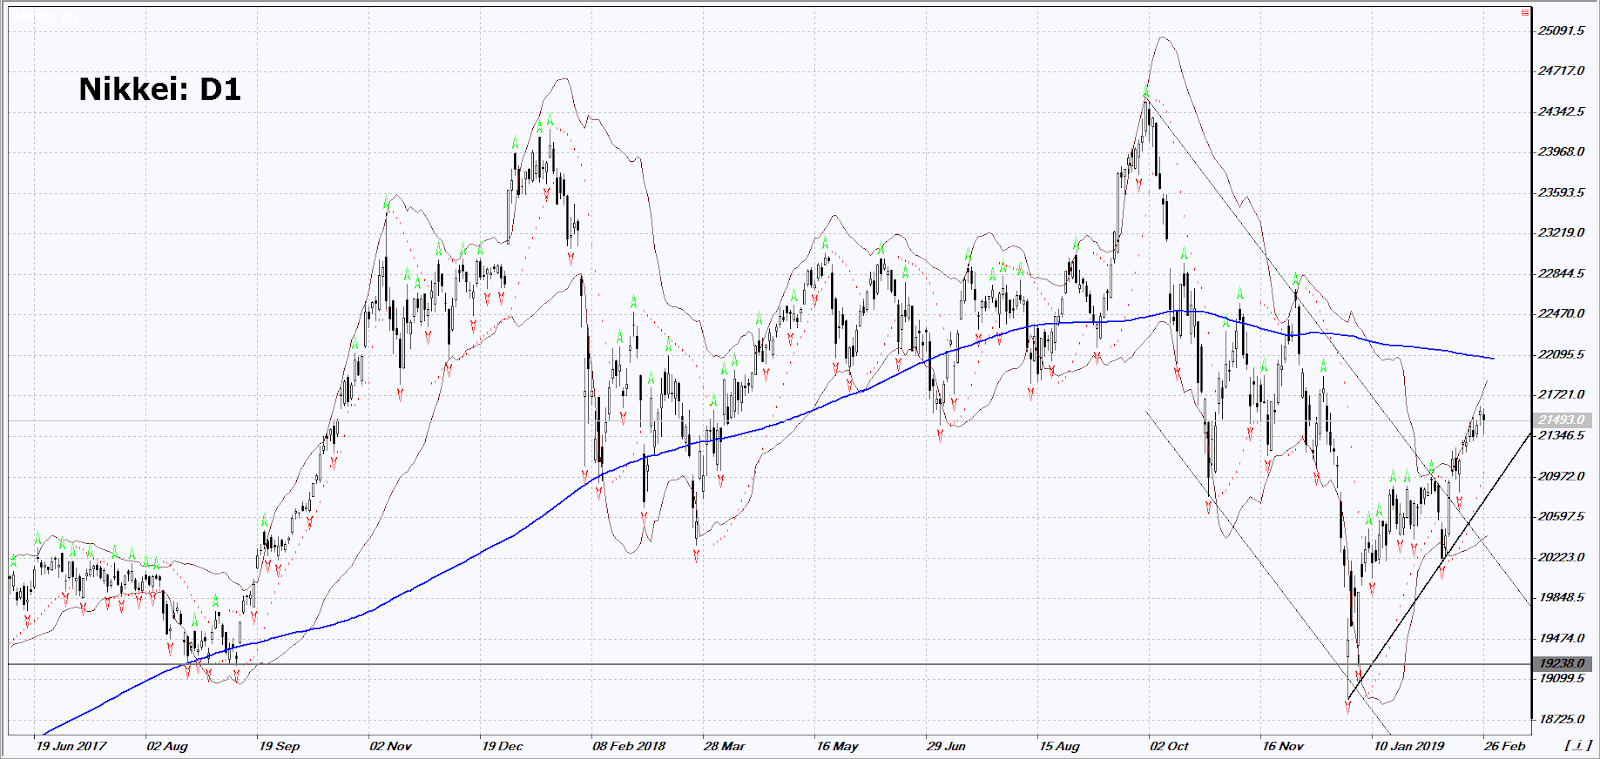
The Japanese Nikkei adjusted down from the annual maximum
The main reasons for this were the completion of the next financial year in March and the correction of the MSCI All Country Asia Pacific ex Japan stock index from a 5-month high. This regional index does not include Japan, but usually affects the dynamics of Nikkei. The fall in world oil prices caused a decline in oil companies' quotations: Inpex Corp (-3.8%), Showa Shell (LON:RDSa) Sekiyu (-2%) and Cosmo Energy Holdings (-2.3%). The yen slightly strengthened against the US dollar before the speech of the Fed. Australian and New Zealand dollar fell before the publication of the trade balance of New Zealand, which may be negative.
The oil quotations fell after US President's announcement
The US President Donald Trump announced that oil prices are too high and called on OPEC and independent producers to review production volumes. An additional factor in the reduction of quotations was the forecast of commercial oil reserves growth in the United States over the week by 3.6 million barrels. The data will be published today by the independent American Petroleum Institute. The official information regarding reserves will be released tomorrow.


