- All Instrument Types
- Indices
- Equities
- ETFs
- Funds
- Commodities
- Currencies
- Crypto
- Bonds
- Certificates
Please try another search

Pivot Points
What Are Pivot Points?
Pivot Points are prices on a chart calculated by technical analysts. This is a very popular form of technical analysis that can be used for any market, asset, and any time interval.
As well, because many people are aware of these levels, activity near each Pivot Point can create trading opportunities. Traders and investors often use pivot points to enter or exit positions.
How Are Pivot Points Used?
A bullish investor might buy into a market when the price drops to a lower Pivot Point, expecting the market to return to a higher Pivot Point, where taking profits could be considered.
Most commonly, a set of pivot points includes seven prices: the pivot point, three support levels, and three resistance levels--support levels are below the last price, resistance levels are above the last price. These levels are also sometimes called, respectively, pivot lows and pivot highs.
Pivot point theory considers a market bullish when price consistently trades and closes above the pivot point (P). The bullish bias is even stronger when a market trades and closes above the first pivot resistance (R1).
Conversely, a market is considered bearish when price consistently trades and closes below the pivot point. A very strong bearish bias occurs when price trades and closes below the first pivot support (S1).
The high, low, and close of the preceding time interval, e.g. daily, weekly, etc., are used to calculate Pivot Point support and resistance levels.
Classic Pivot Point Formulas
The following are formulas for Classic pivot point theory, the most commonly used version of this calculation:
P = (High+Low+Close)/3
S1 = (P*2)-High
S2 = P-(High-Low)
S3 = P-2(High-Low)
R1 = (P*2)-Low
R2 = P+(High-Low)
R3 = P+2(High-Low)
Additional types of pivot points incorporate principles from other theories, e.g., Fibonacci, Camarilla, Woodie’s, and DeMark, although the core calculations of each of these types still include the high, low, and close of the preceding period.
Finding Pivot Point Information on Investing.com
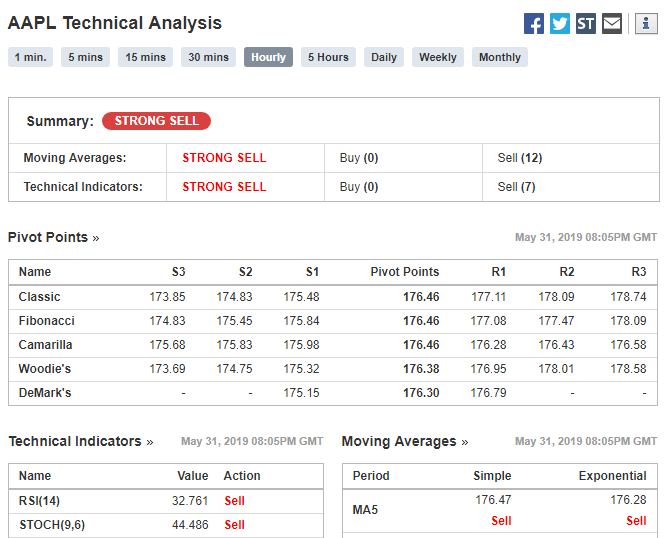
Investing.com’s ‘Technical’ section contains instant calculations for classic and other pivot points for every market and each interval.
To navigate to this section, go to the black bar at the top of each page and hover over the Technical tab. e.g. apple technical analysis A number of links will appear, including for ‘Pivot Points.’
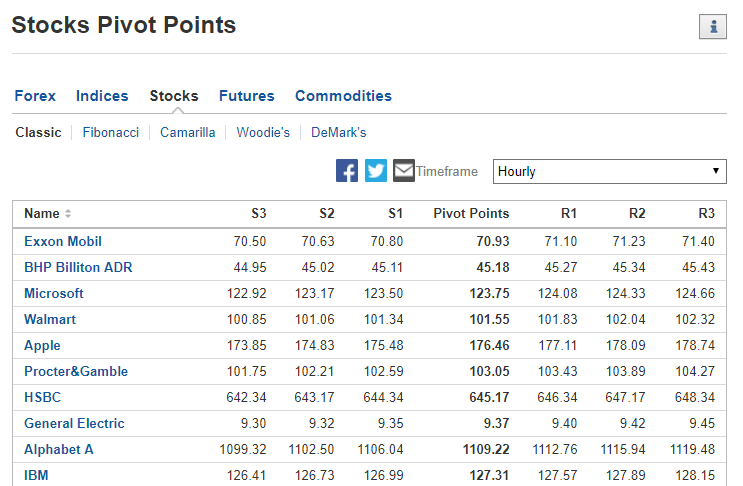
Links on the ‘Pivot Point’ page allow users to search for their preferred assets as well as for the desired type of pivot point. Use the dropdown box directly below the links, on the right hand side of the page, to filter for preferred intervals.


