- All Instrument Types
- Indices
- Equities
- ETFs
- Funds
- Commodities
- Currencies
- Crypto
- Bonds
- Certificates
Please try another search

Free Cash Flow
What Is Free Cash Flow?
Free Cash Flow (FCF) is the excess cash a company generates that, after expenses are deducted, could be available to shareholders. It is the cash available once a company pays its operating expenses, capital expenditures and any other costs required for the smooth operation of the business.
FCF is important to investors because it is the cash that could be quickly distributed to shareholders of a company--if a company chooses to do so--making it an important measurement of a business’s value.
Increasing FCF is valued by investors not only because it could be distributed to shareholders via dividends or share buybacks, but also because it creates opportunities for the company that would not be available without the extra cash. FCF can be used for things like paying down debt to reduce finance costs, investing in equipment or property, and purchasing other companies to improve industry clout or expand to new branches of industry.
Any of these uses of FCF would be expected to improve company earnings and eventually the stock price.
Alternatively, weak or declining FCF is an indication that the company may be unable to maintain a healthy level of earnings and it may be required to increase its debt load to maintain operation. The lack of FCF may also be an indication that the company will encounter difficulties meeting its short term obligations.
Calculating Free Cash Flow
Although several methods of calculating FCF are commonly used, the quickest method is to subtract capital expenditures from operating cash flow.
Free Cash Flow = Operating Cash Flow - Capital Expenditures
Finding Free Cash Flow Information on Investing.com
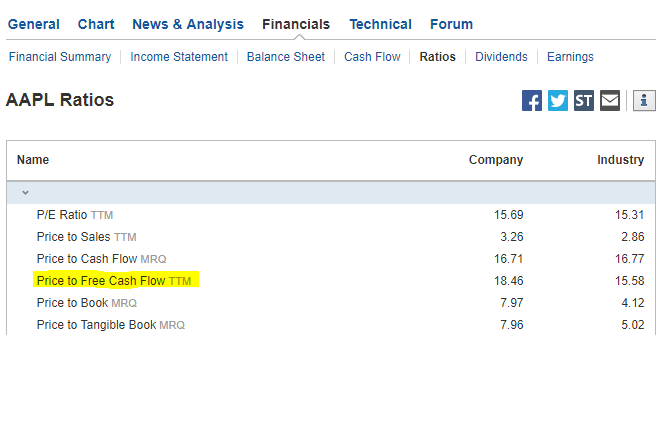
A company’s FCF can be calculated from its Cash Flow Statement. On the Investing.com site, that can be found under the Financials tab on the main page of every stock, e.g., Apple (NASDAQ:AAPL).
Under the Ratios link, users can find a table that includes the Price to Free Cash Flow calculation TTM (trailing twelve months) for the company and the industry overall in two separate columns, beneath the first subhead ‘Valuation Ratios.’ A lower Price to Free Cash Flow can indicate that a company and its stock are undervalued relative to peers. A higher Price to Free Cash Flow could signal a company and its stock are overvalued relative to peers.

Comparing these columns provides a good perspective about the company relative to its peers.


